Full year 2011 Results
Press Release
Haaksbergen, the Netherlands
3 Apr 2012
TKH books record turnover of more than € 1 billion
Annual Results 2011: TKH books record turnover of more than € 1 billion
Highlights 2011
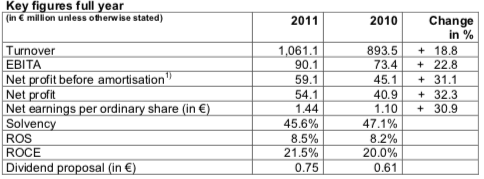
- Turnover up by 18.8% to € 1.06 billion, organic growth 15.5%.
- Sharp rise in EBITA by 22.8% to € 90.1 million due to the Industrial Solutions segment.
- Acquisitions in Building Solutions give TKH stronger foundation.
- Strengthening of the organisation and market positions, as well as one-off acquisition and integration costs impact Building Solutions results.
- Dividend proposal € 0.75 per (depositary receipt for an) ordinary share.
Highlights Q4
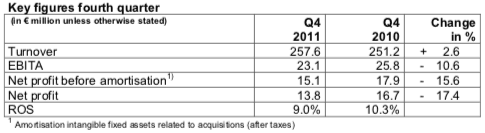
- Turnover up by 2.6% - organic growth 1.6%.
- EBITA down by 10.6% in the fourth quarter -
- ROS of 9.0%.Weakening market conditions in the industrial sector.
- Challenging market conditions, with pressure on margins in connectivity segment within Building Solutions.
Alexander van der Lof, CEO of TKH:
“Innovations made a significant contribution to the sharp rise in results and the increase in TKH’s market share in 2011. The investments we have made over the past few years are now clearly paying off, in terms of TKH’s much stronger market positioning thanks to the company’s greater ability to differentiate itself from its peers. In the coming years, we will be intensifying the efforts we have made to gain a technological advantage. The acquisitions we made in 2011 will certainly contribute to the technological development within the company and to TKH’s growth in the future. We do not yet have a clear idea of just how much the weakening of several end-markets seen as of the third quarter will impact our results in 2012. The investments we made in the organisation and in the market in 2011 have put TKH in a solid position to increase its market share and to withstand challenging market conditions. The outlook for investments in most market segments is positive. However, the translation of this positive sentiment into concrete orders in the industrial sector is suffering delays, which in the fourth quarter led to lower business levels that had a limited impact on results."
Financial developments
Turnover rose by € 167.6 million (18.8%) to € 1,061.1 million, from € 893.5 million in 2010. Higher raw materials prices charged on to customers accounted for 1.4% of this rise in turnover. Acquisitions accounted for 3.4% of turnover in 2011, while the divestment of the GSM business in 2010 resulted in a drop in turnover in 2011. On balance, organic growth came in at 15.5% in 2011.
Turnover growth was strongest in Industrial Solutions at 25.5%. Turnover within Building Solutions rose by 16.0% and was up by 6.6% in Telecom Solutions. Excluding the impact of the divestment of the Polish GSM business, turnover was up 12.1% in this segment. Over the full year 2011, the contribution to total turnover from Industrial Solutions rose to 49% from 46%, while the contribution from Telecom Solutions fell to 15% from 17% and Building Solutions decreased to 36% from 37%. Innovations again made a significant contribution to increases in turnover, accounting for some 23% of turnover in 2011, up from 21% in 2010.
The gross margin fell slightly to 38.9% in 2011, from 39.0% in 2010. Operating expenses as a percentage of turnover fell to 30.4% in 2011 from 30.8% in 2010, despite higher costs as a result of acquisitions and investments in innovations and the commercial organisation. Improved cost efficiency was partly due to higher business activity levels.
At € 15.3 million, depreciations were higher than in 2010 (€ 13.6 million) due to higher investment levels in 2010 and 2011.
TKH’s operating result before amortisation of intangible assets (EBITA) rose by 22.8% to € 90.1 million in 2011, from € 73.4 million in 2010. The EBITA at Industrial Solutions rose sharply compared with 2010. At Telecom Solutions, EBITA fell as a result of the divestment of the GSM activities in the third quarter of 2010. Excluding this divestment, Telecom Solutions booked a 19.8% organic rise in EBITA. Building Solutions booked a 12.9% drop in EBITA, largely due to one-off acquisition and integration costs of € 2 million, as well as the strengthening of R&D and the sales organisation and pressure on margins in the connectivity segment.
ROS rose to 8.5% in 2011, from 8,2% the previous year. This rise was realised despite the integration costs and investments in the organisation and is a direct result of the high innovation level at TKH, as well as improved coverage and efficiency, primarily within Industrial Solutions.
Amortisation costs were up by € 1.7 million to € 13.1 million, compared with € 11.4 million in 2010, due to investments in R&D, software and patents (+ € 0.7 million) and the acquisition of Alphatronics in 2010 and Siqura, Mextal, FlexPosure and KLS Netherlands (+ € 1.0 million).
Financial expenses rose to € 7.5 million in 2011 from € 7.1 million in 2010. This increase was largely due to higher outstanding interest-bearing debt, despite a positive currency effect of € 0.4 million compared with 2010. The result from participations rose by € 0.2 million to € 0.1 million.
The tax burden fell to 22.3% in 2011 from 24.7% in 2010, largely as a result of the application of the Dutch innovation box. This includes a one-off benefit for previous years. The normalised tax burden came in at around 25%.
Net profit before amortisation came in at € 59.1 million in 2011, compared with € 45.1 million in 2010. Net profit rose to € 54.1 million in 2011, an increase of 32.3% from the € 40.9 million recorded in 2010. Ordinary earnings per share came in at € 1.44, compared with € 1.10 in 2010.
Operational cash flow fell to € 47.4 million in 2011, from € 55.2 million in 2010, due to an increase in working capital. In 2011, working capital as a percentage of turnover rose to 11.6%, from 9.9% in 2010.
Net investments in real estate and equipment came in at € 21.9 million in 2011. A large part of this was related to investments in production facilities. TKH invested another € 34.5 million in acquisitions and participations. At year end 2011, net bank debt stood at € 100.5 million, an increase of € 36.6 million from year-end 2010. Solvency fell to 45.6% from 47.1% in 2010. TKH is operating well within the financial ratios agreed with its banks. The net debt/EBITDA ratio came in at 0.9 and the interest coverage ratio at 13.0. At year-end 2011, TKH closed a new € 250 million five-year committed credit facility. The company also renewed and raised its non-committed credit facilities.
At year-end 2011, TKH had a workforce of 4,062 FTEs, up from 3,706 a year earlier.
Progress in realisation of goals and execution of strategy
TKH continued to increase the differentiating potential of its activities in 2011, which allowed the company to expand its leading positions in the niche markets in which TKH operates and to claim new market positions. TKH made good progress in the transformation of the group. The company made considerable investments aimed at realising TKH’s goals for the coming years. The security segment is one very important part of the group that saw heavy investment. TKH believes it can make substantial improvements to its overall ROS by shifting the mix of activities towards those with greater added value. Increasing TKH’s differentiating potential through innovation will play a very significant role in the transformation of the company. The ROS rose to 8.5% in 2011, from 8.2% in 2010, which again brought us closer to our ROS bandwidth target of between 9% and 10%.
TKH realised a ROCE of 21.5% in 2011, up from 20.0% in 2010, through a combination of strong margin improvement and effective working capital management. This exceeded our ROCE bandwidth target of 18% to 20%. We do not see any reason at this point to adjust this bandwidth, as a greater focus on acquisitions in the coming years could exert a downward pressure on the ROCE in the first years after an acquisition. However, various TKH activities still have a great deal of room to improve their ROCE and TKH has launched a number of initiatives with this goal in mind.
TKH took several steps in its acquisition strategy in 2011 with the acquisition of Siqura (security), Mextal (care), FlexPosure (parking) and KLS Netherlands (care).
As a result of its refinancing, TKH now has between € 100 and € 150 million available for acquisitions. We will be giving a high priority to acquisitions that also enable us to strengthen our activities geographically and boost our technological development, primarily in the security systems segment.
The fact that innovation accounted for no less than 22.8% of turnover in 2011, up from 20.9% in 2010, is proof yet again of the success of the TKH group. Innovations are a powerful motor for TKH group’s organic growth.
Business per solutions segment
Telecom Solutions
Profile
Telecom Solutions develops, produces and delivers systems for applications from basic outdoor infrastructure for telecom and CATV networks to indoor home networking. The focus is on providing customers with care-free systems due to the system guarantees we provide. Around 40% of the portfolio consists of optical fibre and copper cable for node-to-node connections. The remaining 60%, consisting of components and systems in the field of connectivity and peripheral equipment, is used mainly in the network’s nodes.
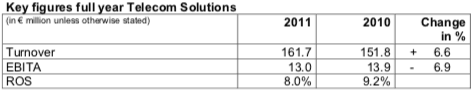
Turnover at the Telecom Solutions segment rose by 6.6 % to € 161.7 million. The divestment in the third quarter of 2010 of the GSM activities in Poland had a negative impact of 5.7% on turnover on 2011. Turnover rose by 12.1% organically. Growth in turnover came from the segments fibre network systems and indoor telecom systems. The copper network systems segment booked a drop in turnover.
EBITA was down compared with 2010, largely as a result of a one-off gain of € 2 million in the third quarter of 2010 due to the divestment of the GSM activities. Excluding this divestment, EBITA was up year-on-year in every quarter of 2011, and rose by 19.8% over the full year.
Indoor telecom systems - home networking systems, broadband connectivity, IPTV-software solutions – 4.4% turnover share
Turnover was up 5.9% in this segment, thanks to higher consumer spending and a higher priority on investments in multimedia systems and peripherals for upgrading broadband connections.
Fibre network systems – fibre optic, fibre optic cable, connectivity systems and components, active equipment – 7.1% turnover share
Turnover was up 18.3% in this segment, primarily due to strong second and fourth quarters. It was easier to obtain financing for investments in optical fibre networks in 2011 than in the previous year. The number of project in the pipeline increased, which confirmed that there is still potential growth in the investment in optical fibre networks.
The worldwide demand for optical fibre rose by 9% in 2011. The growth in volume at TKH was more or less in line with market growth. The expansion of production capacity for optical fibre in China to over 4.5 million kilometres that TKH started in 2011 will be operational in early 2012. In addition, the first quarter 2012 will see the opening of the new Chinese production facility for the manufacturing of preforms - a joint venture between three parties in which TKH has a 12.5% stake. These investments have strengthened TKH’s position in the global market for optical fibre systems.
Copper network systems – copper cable, connectivity systems and components, active equipment – 3.8% turnover share
Turnover in this segment fell by 9.5%. Excluding the drop in turnover due to the divestment of the GSM activities, turnover rose by 7.8%. This increase was primarily due to the strong growth in connectivity systems thanks to increased levels of investment in the maintenance of copper networks.
Building Solutions
Profile
Building Solutions develops, produces and delivers solutions in the field of efficient electro technical technology ranging from applications within buildings to technical systems which, linked to software, provide efficiency solutions for the care and security sectors. The know-how focuses on connectivity systems combined with efficiency solutions to reduce the throughput-time for the realization of installations within buildings. In addition, the segment focuses on intelligent video, intercom and access monitoring systems for a number of specific sectors, including elderly care, parking and security for buildings and work sites.
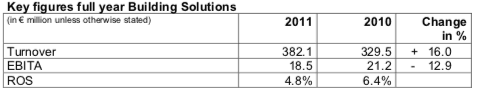
Turnover at the Building Solutions segment rose to € 382.1 million, an increase of 16.0% from 2010. Acquisitions accounted for 8.9% of this growth, while increased raw materials prices accounted for 1.7%. Including a one-off gain accounted for as turnover in 2010, related to the relocation of a production facility in China, organic growth came in at 6.7%. All segments contributed to this growth. The security segment recorded the largest rise in turnover, partly due to the acquisition of Alphatronics and Siqura.
EBITA fell in 2011 to € 18.5 million. Difficult market conditions due to lower activity levels in the construction sector had a negative impact on results. Margins were under pressure in the connectivity segment. In addition, TKH incurred one-off costs of € 2.0 million in the first half of 2011 related to the acquisition and integration of Siqura. In 2011, TKH also invested heavily in innovations and in R&D and its commercial organisation. These investments improved TKH’s ability to realise further market share growth. Margins (ROS) fell to 4.8% in 2011, from 6.4% in 2010. In the fourth quarter of 2011, ROS stood at 5.6%.
Building technologies – energy-saving light and light switch systems, energy management systems, care systems, structured cabling systems – 7.8% turnover share
Turnover in this segment was up 16.3%, due to acquisitions and the expansion of TKH’s market share in the utilities sector. This expansion was largely thanks to the innovations TKH launched in the field of care systems and to the rising demand for efficiency solutions in the field of energy and structured cable systems aimed at cutting installation times. TKH increased investments in product and market development to further strengthen the company’s position in this very promising segment.
Security systems – systems for CCTV, video/audio analysis and detection, intercom, access control and registration, central control room integration – 11.3% turnover share
Turnover rose by 34.5% in this segment. The high-grade in-house technology obtained through the acquisition of Siqura has greatly improved TKH’s chances of winning larger, international contracts. TKH’s ability to differentiate itself, especially in the field of video analysis and detection systems and integrated security solutions, has enabled the company to gain new market positions. The company has also increased its R&D and marketing power by combining activities in the security cluster. The one-off costs related to the acquisition and integration of Siqura had a negative impact on results. TKH also continued the positioning of security solutions in the market for parking and tunnels and was rewarded with a number of excellent contracts. The positioning in the market for tunnel technology is especially promising, in view of the high investment levels expected in Europe in the coming years.
Connectivity systems – specialty cable, connectivity components and systems for shipping, rail, infrastructure, solar and wind energy as well as installation and energy cable for niche markets – 16.9% turnover share
Turnover in this segment was 6.0% higher than the previous year, with half of this increase due to higher raw materials prices. Market conditions were challenging due to the lower volumes in the construction sector and the resultant pressure on margins. TKH invested heavily in the development of its portfolio, its services and its organisation, to enable TKH to strengthen its market position and increase its market share in the niche markets in which the company operates. This resulted in a number of new contracts in the second half of 2011, primarily in the European market, which will lead to higher activity levels in 2012. TKH expanded it production capacity through ‘lean’ programmes, creating the capacity for continued growth. Turnover in solar solutions fell in the fourth quarter due to the German government’s reluctance to extend subsidies.
Industrial Solutions
Profile
Industrial Solutions, develops, produces and delivers solutions ranging from specialty cable, plug and play cable systems to integrated systems for the production of car and truck tyres. Its knowledge in the field of automation of production processes and the improvement of the reliability of production systems gives TKH the distinctive ability to respond to the need in a number of specialised industrial sectors, such as tyre manufacturing, robotics, medical and machine construction industries, to increasingly outsource the construction of production systems or modules.

Turnover at the Industrial Solutions segment rose to € 517.2 million, with 1.6% of the increase due to higher raw materials prices. The increase in turnover was largely thanks to a number of successful innovations, in both connectivity systems and manufacturing systems.
EBITA rose to € 69.6 million in 2011. The strong rise in turnover and related improvement in coverage and efficiency led to a sharp rise in EBITA. The ROS climbed to 13.5% in 2011, from 11.6% in 2010.
Connectivity systems – specialty cable systems and modules for the medical, robot, automotive and machine building industries – 23.3% turnover share
Turnover was up 17.4% in this segment. Higher raw materials prices had a positive impact of 3.1% on turnover. In the fourth quarter of 2011, turnover dropped due to a reluctance to invest in the industrial sector. Despite this, demand from the robot, medical and machine building industries remained high, primarily in Germany. Demand continued to increase for complete modules and systems, which enabled TKH to win market share in this segment.
Manufacturing systems – advanced manufacturing systems for the production of car and truck tyres, can washers, product handling systems and machine operating systems – 25.4% turnover share
Turnover rose by 34.0% in this segment, with growth primarily driven by the tyre building systems segment. This growth was largely realised in Asia. The tyre manufacturers that opt for TKH’s technology are constantly winning ground in their markets due to the high quality levels and production efficiency of the technology. In addition to our Asian clients, several western tyre manufacturers have announced investment programmes aimed at capacity and efficiency improvements. The second half of 2011 saw a marked slowdown in the translation of outstanding tenders into concrete orders. The high investment levels announced by the tyre manufacturing industry did not translate into a higher order intake in the fourth quarter of 2011. However, TKH’s market share remained at the same level as in 2010. The order intake amounted to € 80 million in the second half of the year and was in line with the level seen in the first half of 2011, but markedly lower than in the previous year. The outlook for investments from the tyre manufacturing industry remains positive, which means the delays in orders looks to be short-lived.
The other segments in manufacturing systems all booked a rise in order intake and increases in turnover.
Dividend proposal
At the Annual General Meeting of Shareholders to be held on 15 May 2012, TKH will propose to pay a dividend of € 0.75 per (depository receipt for a) share, compared with € 0.61 in 2010. This is equivalent to a pay out ratio of 52.1% of net profit. TKH will propose that the dividend be paid out optionally in cash or shares and be charged to the reserves. The pay-out of the dividend in shares will be determined one day after the end of the optional period on the basis of the average share price in the last five trading days of said optional period, which will end on 4 June 2012. The dividend will be payable, either in cash or in shares, on 7 June 2012.
Outlook
The market conditions in the segments in which TKH operates show a mixed picture. It is unclear at this point what impact the economic conditions will have in the coming year.
At Telecom Solutions, we expect to see a continued increase in investments in optical fibre networks. European plans for the roll-out of fibre-to-the-home (FTTH) connections are now further advanced and our market share in the European market puts us in a very good position to grow in line with market growth. Turnover in copper networks will continue to fall in line with the shift in investments to optical fibre networks.
At Building Solutions, we expect market conditions to be challenging due to lower levels of investment in the construction industry. In 2011, TKH put a lot of effort into creating the conditions that will enable the company to win market share in the coming years. On balance, we expect that our ability to differentiate TKH through its innovations will help us to realise growth, provided economic conditions in Europe do not deteriorate further.
At year-end 2011, the order portfolio at Industrial Solutions was lower than at the end of the previous year. However, the investment programmes announced within the industrial sector do promise a return to growth in the order portfolio, provided global economic conditions do not worsen. We expect the lower order portfolio at year-end 20011 to have a negative impact on turnover and profitability in this segment in 2012.
In view of the uncertain economic conditions, it is still too early to issue a profit forecast for TKH as a Group for 2012. As usual, TKH will strive to give a profit forecast for the full year 2012 at the presentation of its first half results.
The complete press release and the powerpoint presentation can be downloaded in PDF